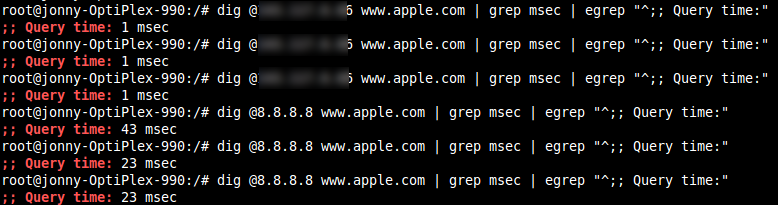
I was trying to check performance on some local DNS servers in comparison to some public DNS servers so I started with using Dig to check the response times between a local DNS server (blurred out below) and one of the Google DNS servers. I first checked a popular domain name and I noticed that the results were skewed in favour of our local DNS:
So our local DNS servers were favoured in this test so next I tested a made-up domain name www.obscuredomainname.com against both servers:
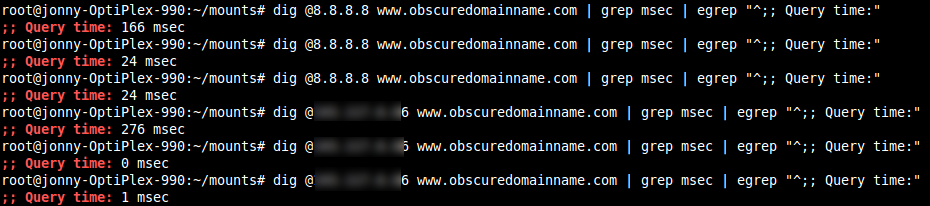
So this time using a fake domain name the first responses were slower with subsequent requests a little quicker. So this very basic test now makes the Google DNS look quicker and that responses to cached requests skew the results too making fair comparisons difficult.
I read the following on the namebench website:
The first run is the one that is most likely to be accurate. The more times to run namebench, the more likely you are to be repeating the same queries over and over again. This will skew your results toward the closest nameserver to you, rather than the one most likely to have your requests cached during normal operations.
One work-around to avoid this is to switch between the Alexa dataset and your favorite browser as a history source. As the Alexa dataset is global in scope, it will tend to skew toward nameservers that cache queries from around the world, however.
So I decided to create something with a little more depth and flexibility.
The following shell script can be run as:
./check_dns_response_times.sh 5 20 y
or interactively as:
./check_dns_response_times.sh
Running the script with command line parameters will set first the number of requests for each domain name – setting this to one would negate the effect of caching presumably. The second setting is the number of domains to check against each server and the third parameter can be y or n to specify whether to use popular domain names or invented obscure domain names. So the example above will request 20 popular domain names from each server and each domain name will be requested 5 times. The results are then averaged.
#!/bin/bash
if test -z “$1”
then
read -e -p “How many requests do you want to make for each domain? ” -i “5” SAMPLE_SIZE
else
SAMPLE_SIZE=$1
fi
if test -z “$2”
then
read -e -p “How many domain names would you like to check $SAMPLE_SIZE times against each server? ” -i “20” NUM_DOMAINS
else
NUM_DOMAINS=$2
fi
if test -z “$3”
then
read -e -p “For sample domain names we can use Alexa as a source or use obscure domain names. Would you like to run the tests against the top domains from Alexa ? ” -i “y” SAMPLE_TYPE
else
SAMPLE_TYPE=$3
fi
if [ $SAMPLE_TYPE = ‘y’ ]; then
urls100=( “www.google.com” “www.facebook.com” “mail.google.com” “www.youtube.com” “mail.live.com” “mail.yahoo.com” “images.google.com” “en.wikipedia.org” “twitter.com” “www.baidu.com” “www.amazon.com” “www.linkedin.com” “www.flickr.com” “apps.facebook.com” “www.vkontakte.ru” “login.live.com” “search.conduit.com” “www.blogger.com” “www.imdb.com” “jp.youtube.com” “www.microsoft.com” “search.yahoo.com” “www.yandex.ru” “www.orkut.com.br” “new.facebook.com” “auction1.taobao.com” “runonce.msn.com” “www.yahoo.com” “www.msn.com” “qzone.qq.com” “tieba.baidu.com” “rapidshare.com” “auctions.yahoo.co.jp” “image.baidu.com” “www.orkut.com” “www.mediafire.com” “ja.wikipedia.org” “news.bbc.co.uk” “www.4shared.com” “www.youku.com” “viewmorepics.myspace.com” “www.ameblo.jp” “www.ask.com” “www.soso.com” “search.yahoo.co.jp” “www.megavideo.com” “www.yahoo.co.jp” “www.orkut.co.in” “www.apple.com” “ad.doubleclick.net” “www.hi5.com” “www.bbc.co.uk” “www.megaupload.com” “de.wikipedia.org” “www.tudou.com” “es.youtube.com” “www.cnn.com” “news.qq.com” “win.mail.ru” “photo.qq.com” “cgi.ebay.com” “shop.ebay.com” “www.thepiratebay.org” “www.tube8.com” “www.mixi.jp” “www.kaixin001.com” “zhidao.baidu.com” “uk.youtube.com” “sports.sina.com.cn” “adwords.google.com” “www.nytimes.com” “www.dailymotion.com” “blog.sina.com.cn” “www.paypal.com” “store.taobao.com” “ad.xtendmedia.com” “www.digg.com” “www.weather.com” “picasaweb.google.com” “translate.google.com” “www.adobe.com” “www.amazon.co.jp” “www.amazon.de” “es.wikipedia.org” “webmail.aol.com” “ad.yieldmanager.com” “fr.youtube.com” “www.twitpic.com” “www.taringa.net” “in.youtube.com” “www.netflix.com” “www.tianya.cn” “news.163.com” “it.youtube.com” )
urls=(“${urls100[@]:1:$NUM_DOMAINS}”)
else
urls=()
for COUNT in `seq 1 $NUM_DOMAINS`
do
urls+=(“www.obscuredomainname$COUNT$TIME.com”)
done
fi
TIME=`date +%Y%m%d%H%M`
TIME_START=`date +%Y%m%d%H%M%S`
HOSTNAME=`hostname`
servers=( “8.8.8.8” “156.154.70.1” “4.2.2.1” “208.67.220.220” “143.117.6.66” )
NUM_URLS=`echo ${#urls[@]}`
for server in “${servers[@]}”
do
CALCULATION=”0 ”
for url in “${urls[@]}”
do
TIME_TOTAL=0
for i in `seq 1 $SAMPLE_SIZE`
do
TIME_TMP=`dig @$server $url | grep msec | egrep “^;; Query time:” | awk ‘{print $4}’`
CALCULATION=$CALCULATION” + $TIME_TMP”
done
done
CALCULATION=”scale=4; (( “$CALCULATION” ) / $NUM_URLS ) / $SAMPLE_SIZE ”
TIME_AVG=`echo $CALCULATION | bc`
printf “$TIME_AVG ms\taverage for server: \t$server\n”
done
TOTAL_QUERIES_PER_SERVER=`echo “$SAMPLE_SIZE * $NUM_DOMAINS” | bc`
TIME_END=`date +%Y%m%d%H%M%S`
printf “Results of $SAMPLE_SIZE DNS queries for each of $NUM_URLS top domain names against each server
(i.e. $TOTAL_QUERIES_PER_SERVER queries to each server)\n”
printf “Test was started at $TIME_START and completed at $TIME_END on $HOSTNAME\n”
I have only used one of each of the public DNS servers. I had found that using for example 2 Google DNS servers that the responses from the second one were quicker even for made up obscure domains – sharing information.
Running this script for 30 popular domains with each domain requested 5 times against each server gave me the following results – and made our local DNS server look very good.
./check_dns_response_times_new.sh 5 30 y
30.4800 ms      average for server:     8.8.8.8
16.9733 ms      average for server:     156.154.70.1
60.3133 ms      average for server:     4.2.2.1
39.6733 ms      average for server:     208.67.220.220
17.9133 ms      average for server:     111.222.111.222
Results of 5 DNS queries for each of 30 top domain names against each server
(i.e.  150 queries to each server)
Test was started at 20130315140735 and completed at 20130315140811 on jonny-OptiPlex-990
Next I ran the same test from a remote server in Germany:
./check_dns_response_times.sh 5 30 y
40.0266 ms      average for server:     8.8.8.8
19.7533 ms      average for server:     156.154.70.1
81.8266 ms      average for server:     4.2.2.1
23.4333 ms      average for server:     208.67.220.220
30.0800 ms      average for server:     111.222.111.222
Results of 5 DNS queries for each of 30 top domain names against each server
(i.e.  150 queries to each server)
Test was started at 20130315141110 and completed at 20130315141152 on www.myowndomainname.net
So I took these tests a step further and ran them once per hour for 36 hours and graphed the averages. I ran my script 4 times per hour from a local computer and from a server off-site:
- 1 request for each of 40 domains for top domains (per Alexa)
- 1 request for each of 40 domains for obscure domain names
- 5 requests for each of 30 domains for top domains (per Alexa)
- 5 requests for each of 30 domains for obscure domain names
I averaged the results after 36 hours and created some graphs. Obviously a more prolonged test would yield more accurate results but I wanted to compare the results against namebench and DNS Benchmark.
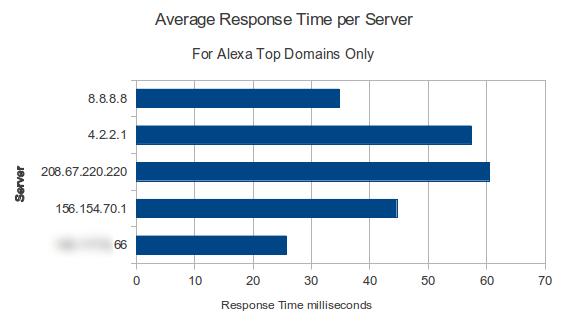
With all the results considered – top domains, obscure domains, requests from on-site and requests from off-site our local DNS server performed well as shown below only slightly slower than Google and UltraDNS.
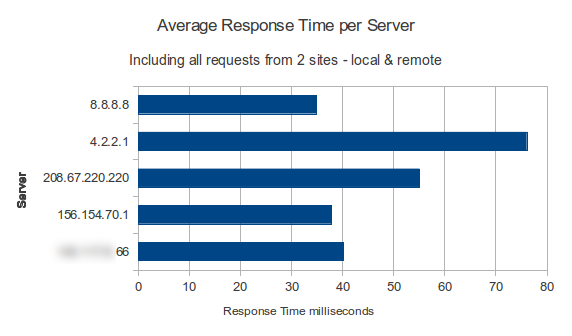 When querying against the top domains our local DNS server came out as fastest presumably as these results are already cached locally.
These results are somewhat comparable to the results from namebench but the ‘DNS Benchmark’ are much different.
If I was to summarise these results I would say that our own local DNS servers give good performance when compared to the public DNS servers especially when used from our local network. Off-site our DNS servers are still pretty good performers.
So I moved on to trying some other tools such as namebench and DNS benchmark to see how these compared to my own results.
Namebench
I downloaded namebench and ran the python script as follows:
#!/bin/bash

DATE=`date +%Y-%m-%d`

mkdir /var/www/html/namebench/output/$DATE

/var/www/html/namebench/namebench.py --no_gui --output=/var/www/html/namebench/output/$DATE/index.html --csv_output=/var/www/html/namebench/output/$DATE/index.csv
This generates a report in HTML format and uses the Alexa top 1000 sites as the source for the domain names. I could customise the report output by editing the templates/html.tmpl and I customised the list of DNS servers to test by removing all the regional ones from ./config/namebench.cfg and adding my local ones to the [private] section for example:
[global]

8.8.8.8=Google Public DNS

8.8.4.4=Google Public DNS-2

156.154.70.1=UltraDNS

156.154.71.1=UltraDNS-2

208.67.220.220=OpenDNS

208.67.222.222=OpenDNS-2

216.146.35.35=DynGuide
[regional]
# These are unlikely to work for most people, but are useful enough to keep
[private]
123.111.123.111=netctral
13.14.15.16=eagle
An example of the graphed output is shown below – first the average reponse times and then the fastest individual response times:
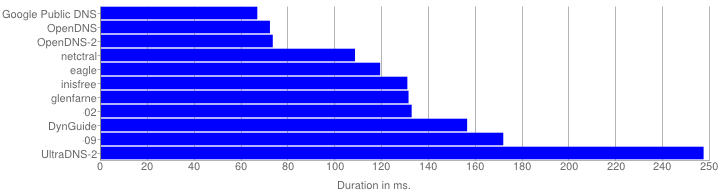
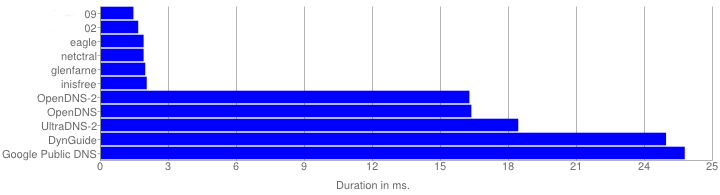
So these graphs are somewhat comparable to my own results showing the Google, UltraDNS and our own servers in the top 3. While our own DNS has the quickest individual responses in the sample, the average response time over the whole sample is approx 40% faster (30-40ms) with the Google (8.8.8.8) or OpenDNS servers.
After this I moved on to ‘DNS Benchmark’.
DNS Benchmark
GRC’s DNS Benchmark uses “Internet’s most popular top-50 domain names” against a range of public DNS servers and your own additions. Example results are shown below:
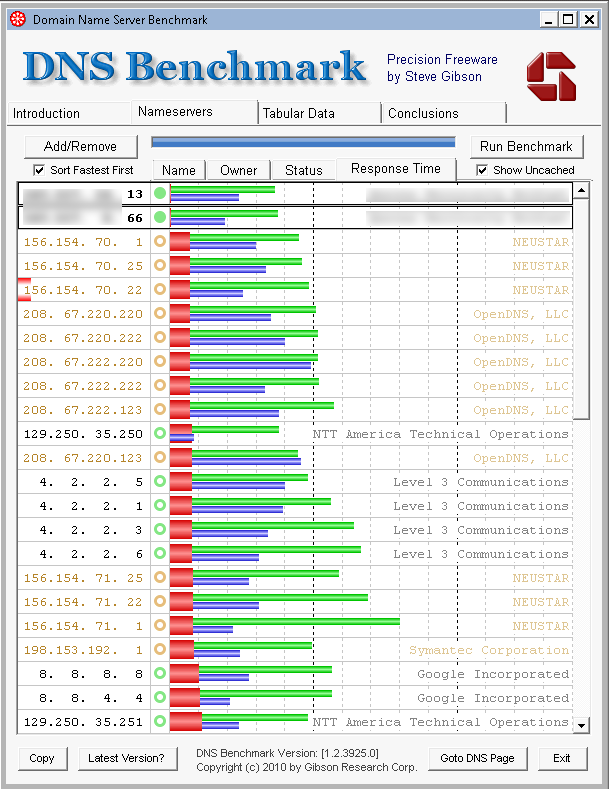
The results are nicely coloured showing separate response times for cached (red) and un-cached (green) queries. These appear to be a slightly different type of test and appear to favour DNS servers with cached results. I am somewhat bemused that the results show our own DNS servers as best followed by UltraDNS, OpenDNS, Level3 and Google much further down the field. This tells a different story to my own tests and those of namebench. In those tests Google came top, followed by UltraDNS, our own local DNS server and OpenDNS.
The DNS Benchmark results show our local DNS servers in a very good light so the could be useful in showing what a good job we do but then I think it would be possible to manipulate any tests to show any of the servers as coming out tops.
Conclusion
You can prove anything with facts, but of the three methods used to test DNS performance here I am happy that our local DNS server performance is up there with the big corps.