These notes describe loading VPC Flow Logs in parquet format into DuckDB for visual analysis in Apache Superset. I had never used any of these components before but was able to visualise the addresses using the most bandwidth. If time permits I may also look at ntopng or openobserve to see if they allow loading parquet files from the filesystem.
Configure Apache Superset
On your filesystem pull the superset repo:
git clone --depth=1  https://github.com/apache/superset.git
cd superset
I found it necessary to amend the path to my .env file within the docker-compose.yaml file as I am using an older version of docker-compose.
DuckDB Support in Superset
We need support for DuckDB inside the superset container so create the file:
vi docker/requirements-local.txtwith the content:
duckdb-engineVolume
We need a volume in the container mapped to the host filesystem so we can provide access to the parquet files. So in the docker-compose.yaml file I added a mount from ./parquet on the host to /parquet inside the container:
x-superset-volumes: &superset-volumes
  # /app/pythonpath_docker will be appended to the PYTHONPATH in the final container
  - ./docker:/app/docker
  - ./superset:/app/superset
  - ./superset-frontend:/app/superset-frontend
  - superset_home:/app/superset_home
  - ./tests:/app/tests
  - ./parquet:/parquet
Copy the VPC Flow Logs to the ‘./parquet’ folder on the host filesystem so that they will be accessible at /parquet inside the container.
Then start the Superset containers:
docker-compose up -dCreate the DuckDB Database
Log in to the Superset UI and visit Settings > Database Connections > + Database
For database type choose ‘Other’ then enter the SqlAlchemy URI as:
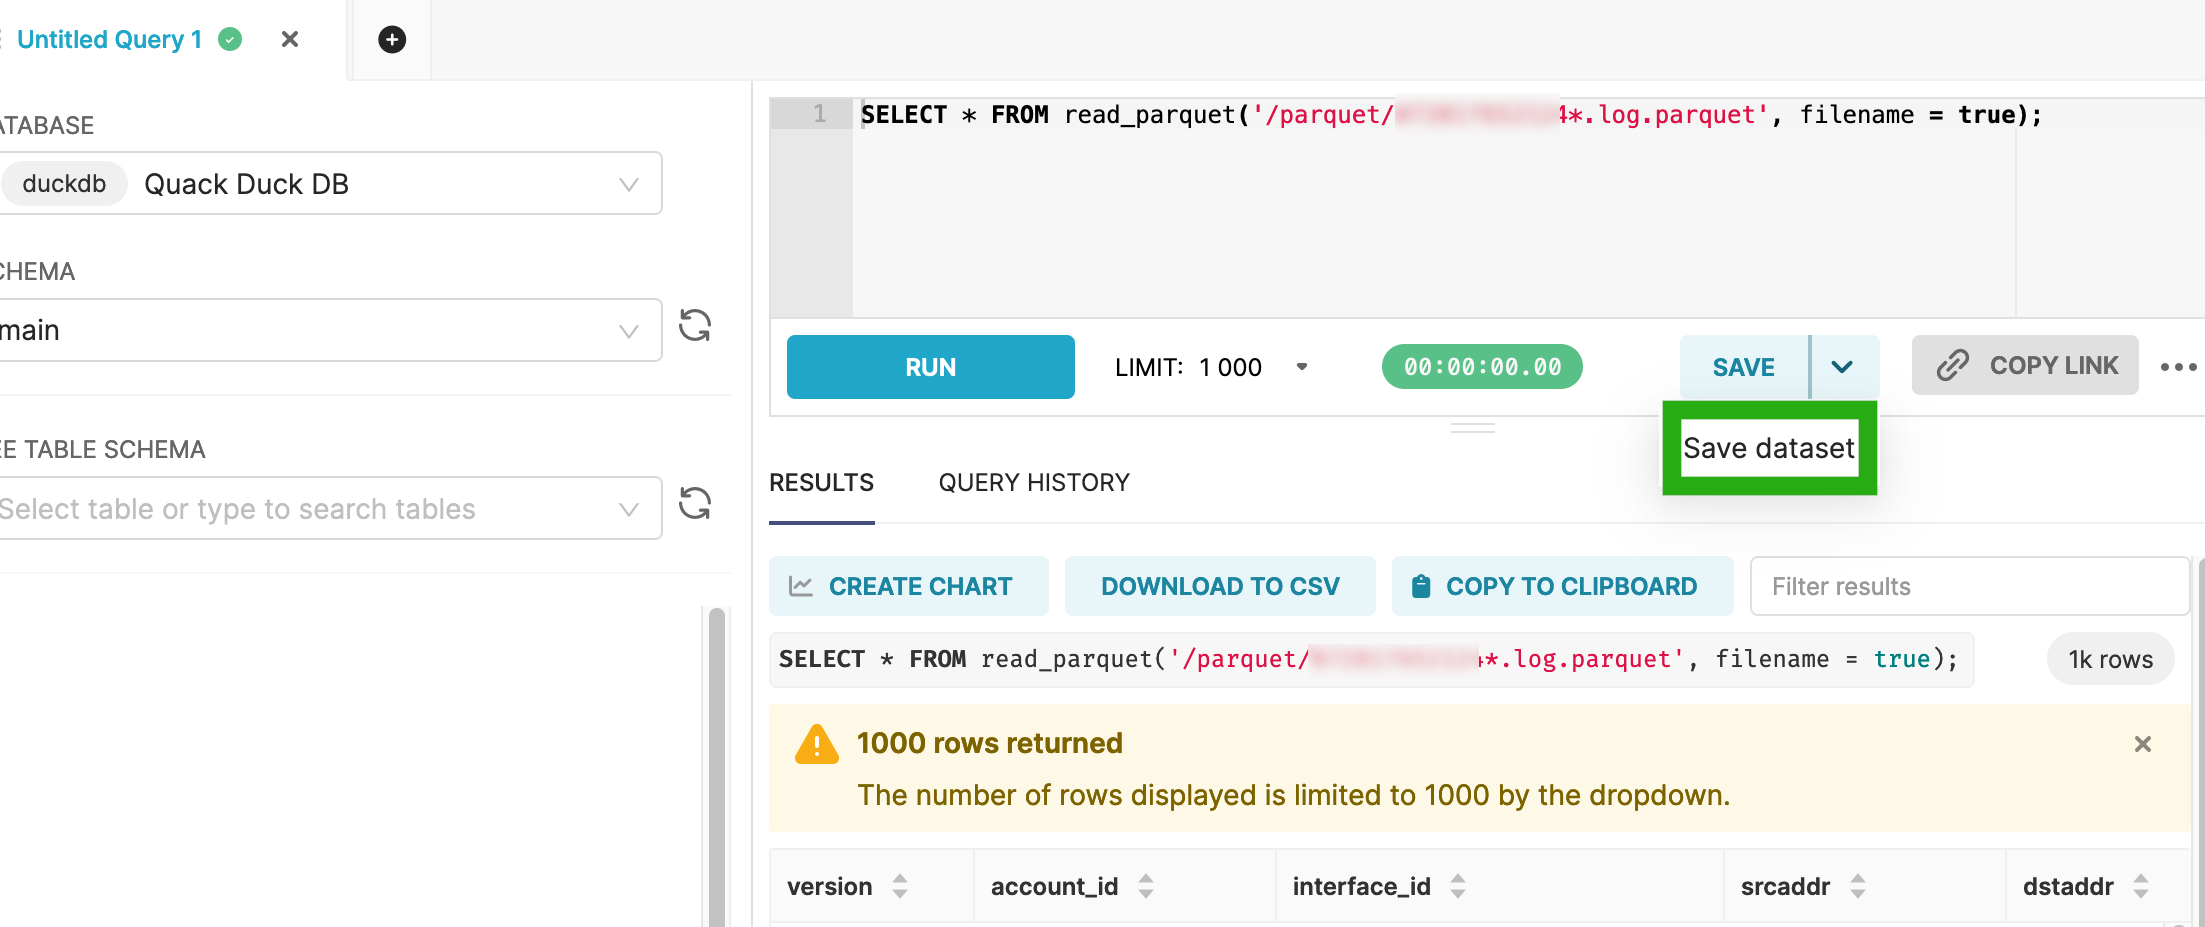
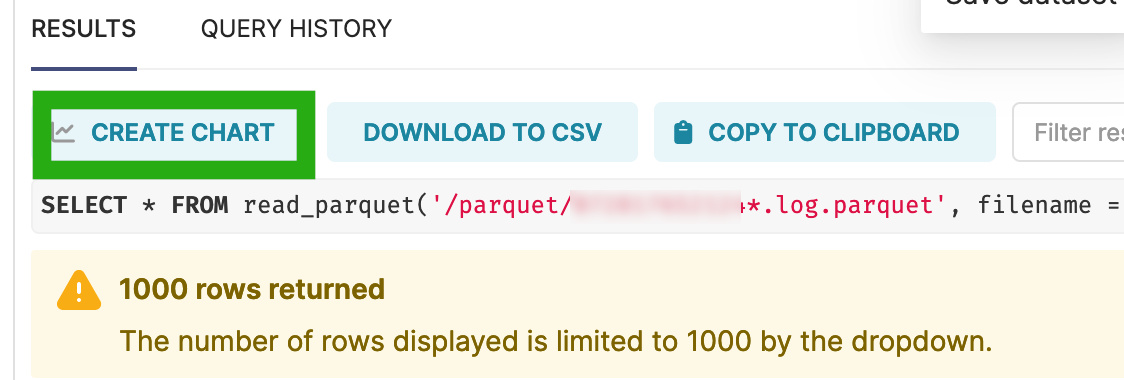
duckdb:////my_duck_db_fileNext visit SQL > SQL Lab and add the following into the editor
SELECT * FROM read_parquet('/parquet/*.log.parquet', filename = true);Choose Run.
Choose Save > Save dataset as shown below, and provide a name for your dataset.
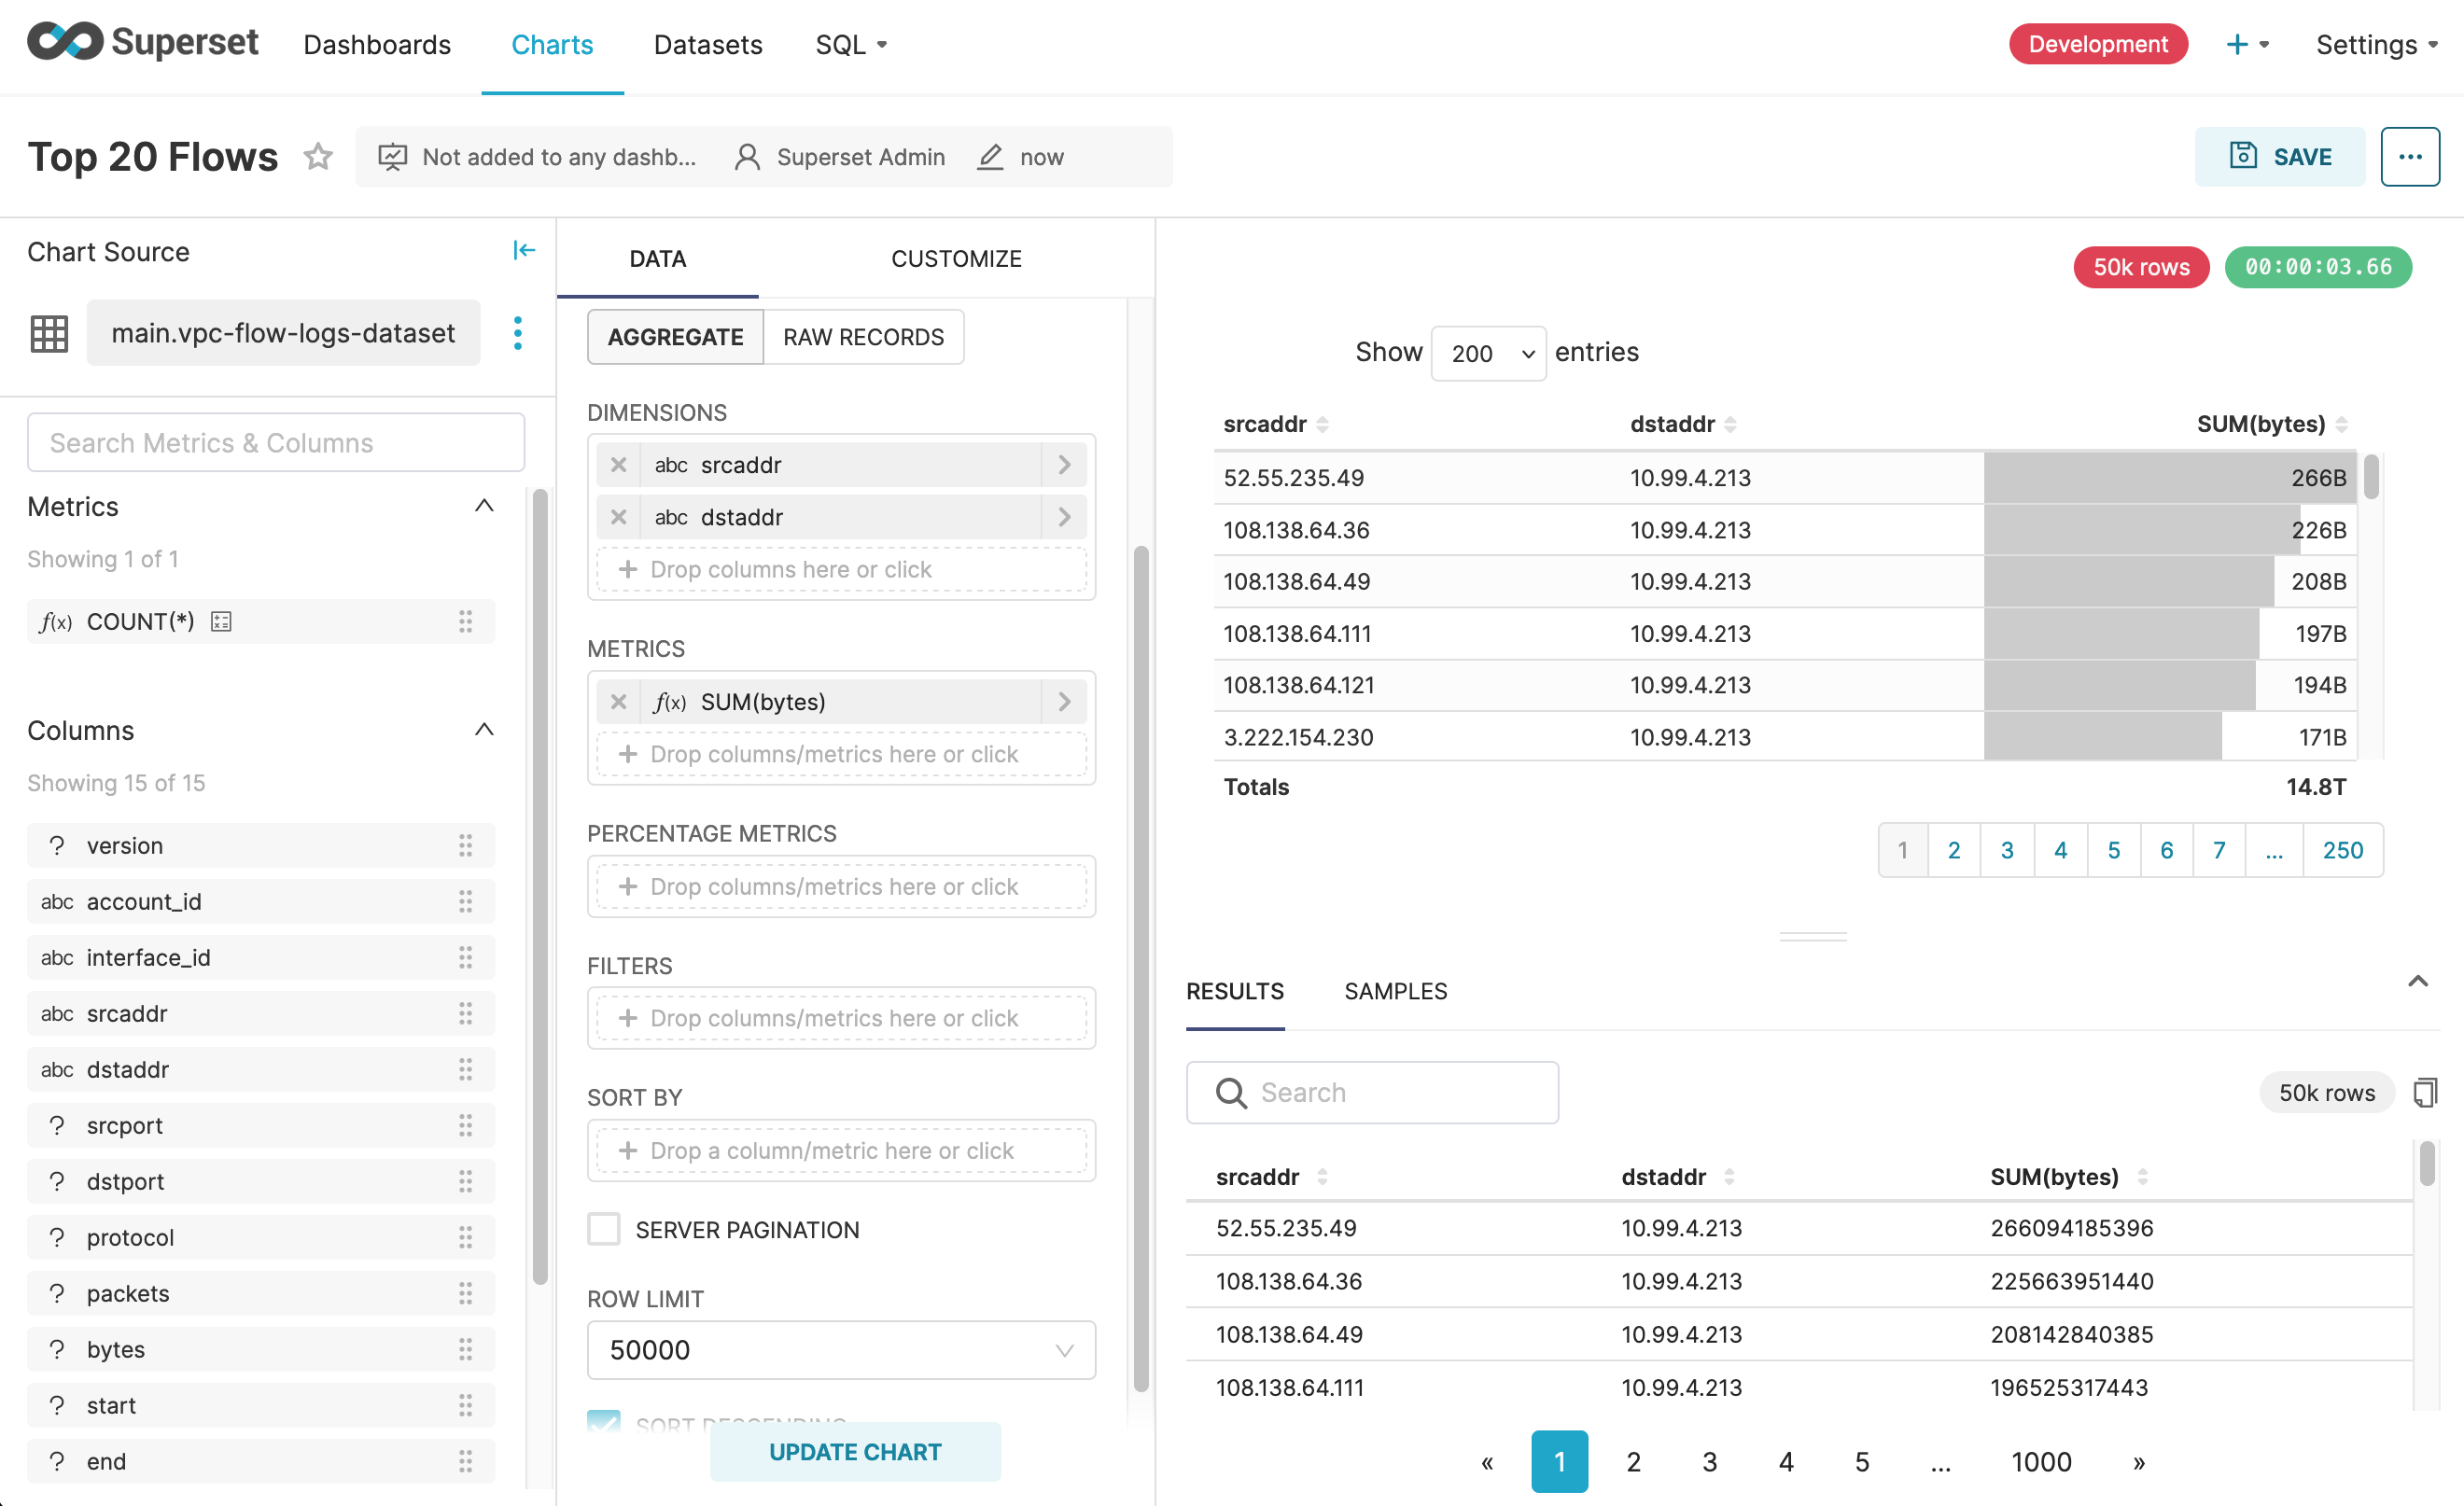
Then choose Create Chart to create a graph based on the dataset.
As shown below I used a table to display the the source address, destination address and a sum of the bytes. I had wanted to use a Sankey Diagram but ran into a loop problem as reported here and the mentioned fix didn’t work for me.