On a misbehaving application we were seeing 200 transactions per second to a MS SQL Server database when normally there would be approximately 10 queries per second.
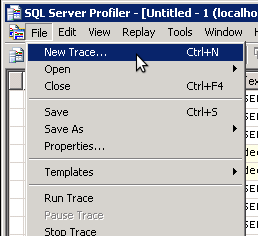
To analyse the type of SQL queries received by the server I used ‘SQL Server Profiler’ as follows:

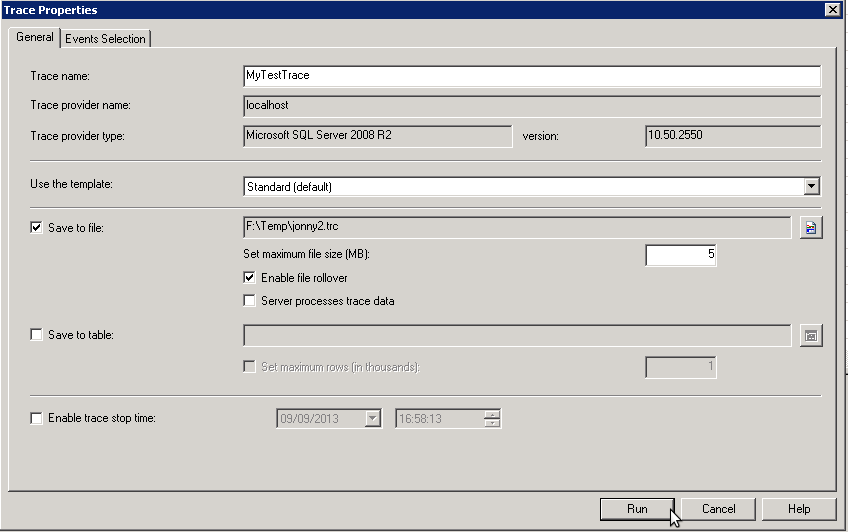
File > New Trace …
Connect to the database if necessary.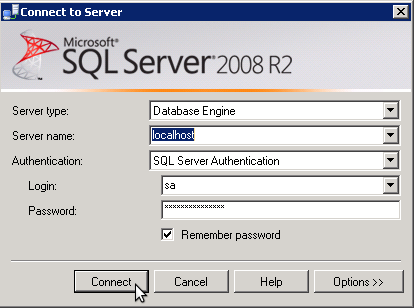
Specify that you would like to save the results of the trace to a file:
 Under the Events Selection tab you can choose the type of events (SQL, Stored Procedures) that you wish to record:
 The results are presented on screen but the trace file could also be opened in another instance of the Profiler:
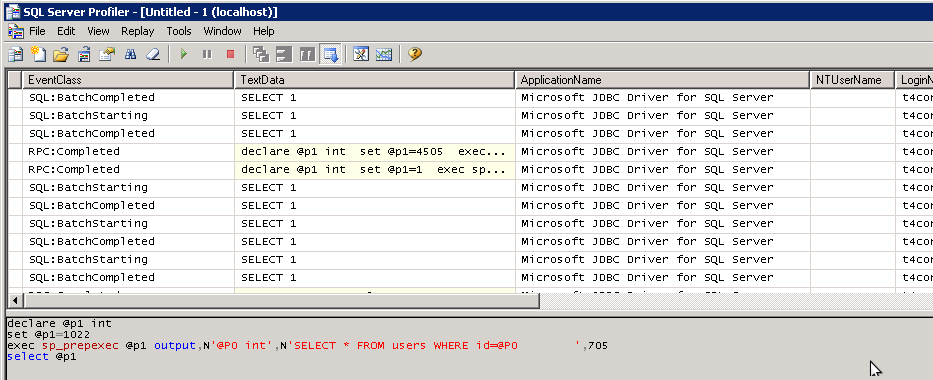
SELECT 1 – how useful is that query?