A revised list of my favourite ‘tops’
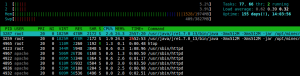
htop
htop can provide a little more info than the traditional ‘top’ – I like how it shows the amount of memory usage minus the cache.
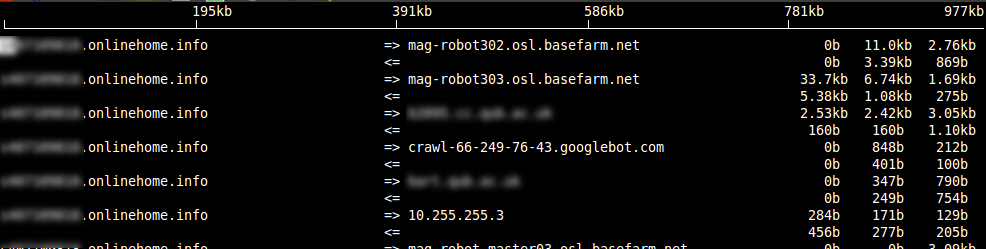
 iftop
iftop

To check network connectivity use iftop:
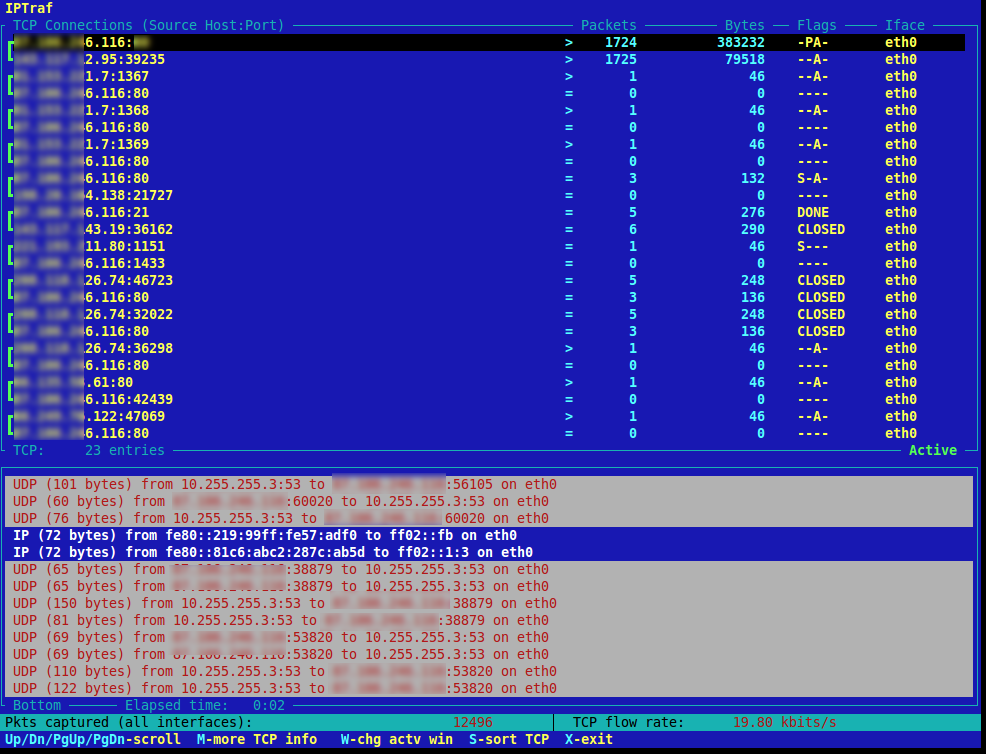
 iptraf
Like iftop but with more options and even the ability to show traffic by port:
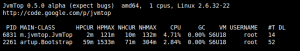
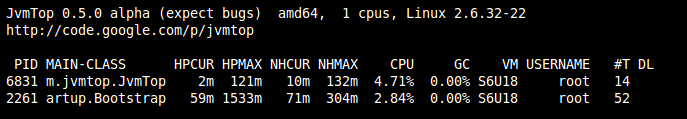
JVM Top
Download the code from http://code.google.com/p/jvmtop/ extract it and run the jvmtop.sh file. You may need to set the $JAVA_HOME variable in the script or environment as it uses Java itself.
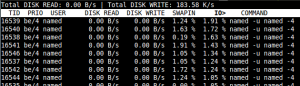
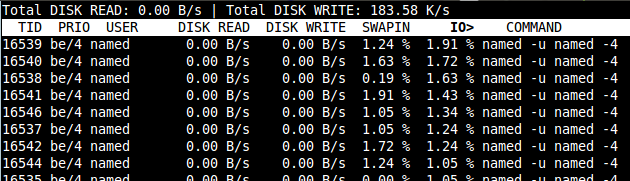
 iotop
iotop
More easily installed on CentOS 6 than CentOS 5. Gives insight into disk read and writes:
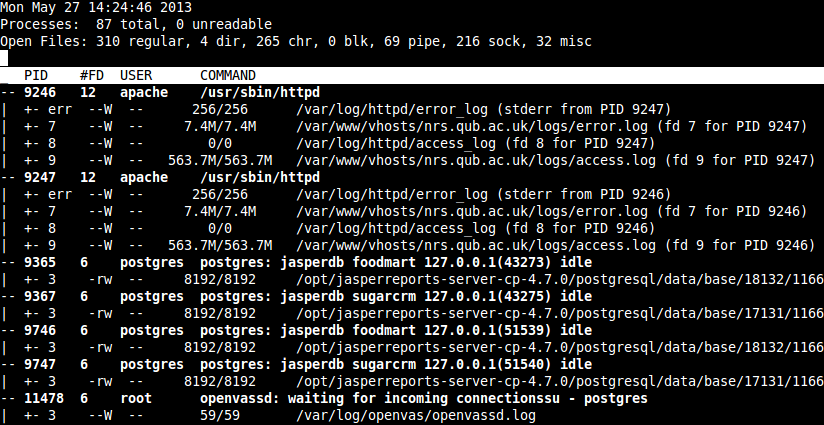
 ftop
ftop
ftop can also to used to narrow down on IO bottlenecks. It shows the processes reading and writing to files:
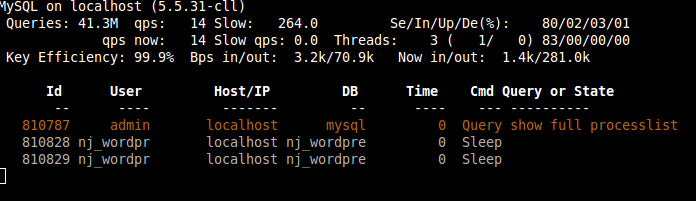
mytop
To use mytop you need to have a configuration file with the database access details i.e. ~/.mytop
user=root
pass=topsecret
host=localhost
db=mysql
delay=5
port=3306
socket=
batchmode=0
header=1
color=1
idle=1
apachetop
Apache Top is available from the ART (atomic) repository, and if pointed at your apache access log will give info such as that below: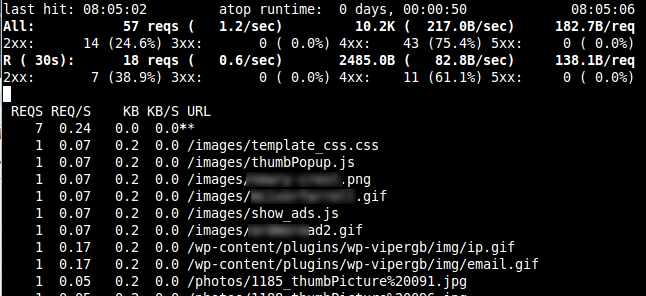
Usage:
apachetop -f /var/log/httpd/access_log
Apache Server Status
This is not really a ‘top’ or command line interface but the Apache Server Status module is invaluable. It shows URLs being requested and their state so is a good first stop when Apache is experiencing difficulties. It must be enabled in the Apache config and then is available at http://server/apache-status
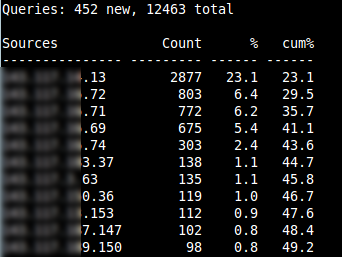
dnstop
On a server with BIND running use:
dnstop eth0